


Low volatility feeds a search for yield
| The RBNZ delivered another 25 bpt increase to OCR |
| The 2 year swp rate remains in a narrow 4.00-4.10% range |
| Global bond markets have also been remarkably stable. Implied volatilities from US treasury bond option contracts have fallen to their lowest since mid-2013 |
| This low volatility has encouraged a search for yield globally. Over the course of April, this was most evident in the NZ 10 year government bond, where global demand saw yields squeezed 20 basis points lower without reinforcing economic news |
| Over the medium term, we continue to see the risks skewed towards higher yields as the global economy recovers, removing the need for to such exceptional monetary policy support |
| One key local event approaching in May is the NZ Budget, where a lower composition of new bond issuance in inflation linked bonds may create an opportunity for inflation breakevens to re-price higher. |
| The announcement of Labour’s monetary policy proposals had little immediate impact on the market. |
The US economic data were a little weaker than expected at the beginning of the year, but since then US economic outturns have been pretty solid – PMIs comfortably above 50, and monthly payrolls averaging a healthy 200k per month. This has kept the US Fed on track with its plan to steadily taper its Quantitative Easing purchases in a way that creates the least policy uncertainty. In April its decision to taper almost went unnoticed by the mainstream media.
In the stable macroeconomic and policy environment, the US 10 year government bond yield has traded in a very tight 2.60-2.75% range for much of the year, ending April near the lower end. Implied volatility from US treasury bond option contracts have fallen to their lowest levels since mid 2013 (Chart 1).
Chart 1: Implied volatility from US treasury options
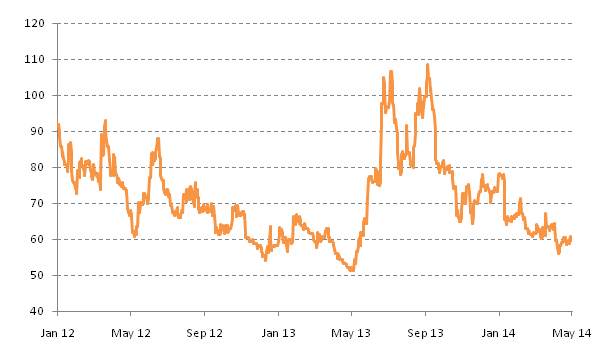
Source: Merrill Lynch and Bloomberg.
Click the button below to subscribe and will have free unlimited access for a limited time to full article and all other articles on the site.
You will also be able to comment on articles on Good Returns.