Tower’s GAM Multi-Trading Proves Its Worth
Hedging funds are proving to be an increasingly popular choice with investors looking to increase the return potential on their investment portfolio. A hedge fund backed by a good investment strategy can potentially provide an investor with safe leverage and healthy returns.
Saturday, September 1st 2001, 5:50PM
A fund
of funds
Tower Managed Funds offers a unique investment opportunity to
New Zealand investors through the Tower GAM Multi-Trading Fund,
a hedge fund domiciled in New Zealand. The Tower GAM Multi-Trading
Fund is one of New Zealand's leading retail hedge funds, returning
17.1% p.a. on average over the last five years, net of tax and
management fees (as at 31 July 2001).
The Tower GAM Multi-Trading Fund comes under a category of hedge funds called "Fund of Funds". These types of funds can offer an effective way for an investor to gain exposure to a range of hedge funds and strategies. They invest in hedge funds with different investment styles, and have an objective of smoothing out the potential volatility of investment returns.
Managed by leading international fund managers, Global Asset Management (GAM), TOWER's GAM Multi-Trading Fund has an aim of providing long-term capital appreciation through active trading in financial and commodity markets with a diversification of risk. This objective is achieved by investing in a number of underlying GAM funds that are invested in a variety of global markets.
Multi-manager investing is an approach that utilises the skills of many external fund managers rather than relying solely on the ability of in-house managers. By "subcontracting" the best external managers, a fund can access a wider range of expertise and investments that it could achieve by handling all the investments itself.
One of the ways GAM achieve the objectives
in our multi-manager trading fund is to allocate assets to independent
investment managers positioned to take advantage of global opportunities
in a variety of investment markets including fixed income, currencies,
equities and commodities.
Comparing returns of major asset sectors with Tower GAM Multi-Trading
Fund
The table below shows that the performance of Tower GAM Multi-Trading, net of tax and management fees, has compared favourably against all the major asset sectors over the last five years. (Data sourced from FundSource and as at 31 July 2001.)
Annualised % Return Sector Average 1 yr 2 yrs 3 yrs 5 yrs Std Dev
NZ Cash Unit Trusts & GIFs 3.8 3.5 3.3 4.0 0.5 NZ Fixed Interest UT & GIFs 4.0 3.6 3.6 4.8 2.1 NZ Property UT & GIFs 2.5 2.7 2.6 1.8 8.4 NZ Equity (Active) UT & GIFs 3.8 5.4 7.2 5.0 12.7 Australian UT & GIFs 0.4 5.8 8.9 10.9 11.5 Int'l Fixed Interest UT & GIFs 5.0 3.4 2.8 5.1 2.9 Int'l Equity (Global) UT & GIFs -11.8 1.8 3.3 11.5 12.8 Tower GAM Multi-Trading 19.6 18.5 11.9 17.1 8.5
Performance of GAM Trading Funds during market volatility
Hedge funds have proven to be one of the better fund options to invest in when markets become volatile. These funds have the ability to take "short" positions when their fund managers feel the markets are likely to fall. Equity funds do not always have this flexibility.
In the following examples, we have compared the performance of major market indices and trading funds during periods of market uncertainty or volatility.
The GAMut Trading Fund during the 1987 crash
This chart shows the performance of GAMut Fund during the 1987 year, now famous for the October sharemarket crash. (N.B. The GAM Multi-Trading Fund was not in existence at this time, so the performance of the GAMut Fund has been shown. GAMut is one of the major funds that GAM Multi-Trading invests into).
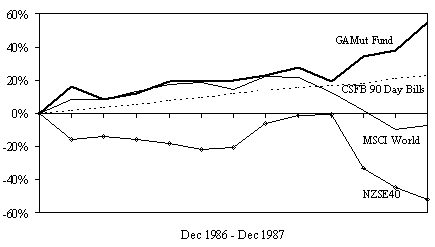
Return Std Dev GAMut 54.5% 24.6% CSFB 90-day 22.9% 1.2% MSCI World -6.9% 21.7% NZSE40 -51.7% 45.4%
1990 Gulf War
In 1990, the impact of the Gulf War coupled with fears of Kuwait oil shortages again caused sharemarkets worldwide to experience negative returns. The NZ equity index fell 24.6% and the international equity market fell 0.8%. In contrast, GAM Multi-Trading had a positive return of 18.5% gross. It also experienced far less volatility in its returns than other indices.
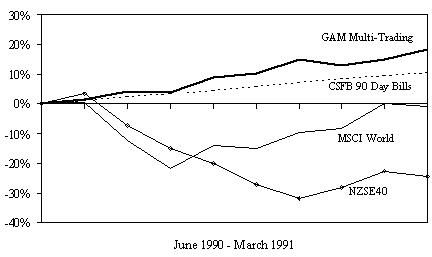
| Return | Std Dev | |
| GAMuti-Trading | 18.5% | 7.3% |
| CSFB 90-day | 10.6% | 0.4% |
| MSCI World | -0.8% | 27.1% |
| NZSE40 | -24.6% | 23.3% |
- The ERM blowout of 1992
- In 1992, the Exchange Rate Mechanism (ERM) "blew out", affecting the financial markets negatively. GAM Multi-Trading experienced a 29.5% gross return over the one-year period to December 1992, while the gross returns for the NZ and international equity markets were lower at 10.8% and 0.2% respectively.
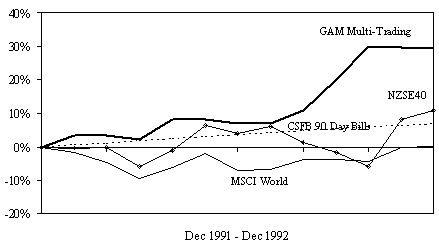
Return Std Dev GAMuti-Trading 29.5%
12.2%
CSFB 90-day 7.0%
0.4%
MSCI World 0.2%
11.6% NZSE40 10.8% 20.3%
Technology, media and telecommunication
(TMT) sectors correction 2000
This final comparison covers the period March 2000 to March 2001,
when the TMT sectors in the US went through a correction. After
a rapid rise in these sectors through the late 1990s, the bubble
finally burst, not only affecting these sectors but equity markets
as a whole.
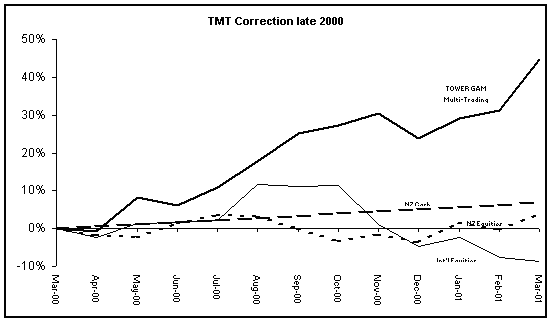
| Return | Std Dev | |
| GAMuti-Trading | 44.8% | 15.7% |
| CSFB 90-day |
|
|
| MSCI World |
|
16.9% |
| NZSE40 | 3.8% | 10.6% |
Improving the Risk/Return Characteristics of a Portfolio
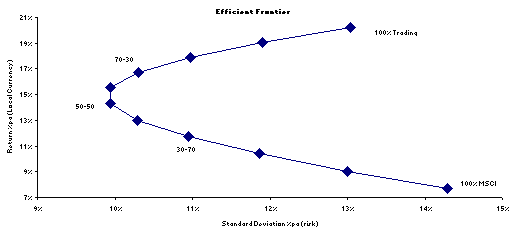
The GAM Multi-Trading Fund has a low correlation with bond and equity markets, particularly on the downside, which means that blending it into a portfolio can improve the overall risk/return.
The following chart demonstrates the effect of combining the GAM Multi-Trading Fund with an international equity portfolio (based on the performance of the MSCI), over a 15-year period 1986-2001. As you can see from the graph, a combination of both trading funds and international equities reduces the overall risk of a portfolio. While this analysis shows that 50/50 as the optimal, analysis over longer and shorter periods will give different results. Other research has indicated that up to 15% of a diversified portfolio should be in trading funds, or up to 30% allocated to trading funds amongst an international equity portfolio being ideal. In all cases, financial advice should always be sought and an investor should have a combination of both in a well-managed portfolio.
Risk/Return Comparisons between Tower GAM Multi-Trading Fund and other unit trusts
The following graph plots the Tower GAM Multi-Trading Fund on a risk/return basis with all other single sector NZ domiciled products sourced by Morningstar. This includes over 450 products, ranging from cash and bond funds through to domestic, regional and global equity funds. It also covers all tax status, unit trusts, group investment funds, insurance bonds and superannuation trusts, and uses five-year data to 31 July 2001.
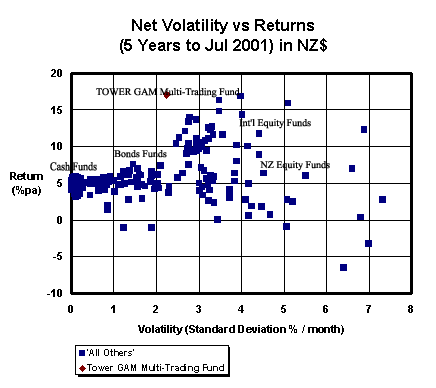
The risk position of the Tower GAM Multi-Trading Fund sits between bond and equity Funds; i.e. it has a medium risk profile. However, the return of the Fund is well above the bond funds, and compares very favourably with most of the equity funds.
In terms of the ideal risk/return characteristics, the GAM Multi-Trading Fund is positioned in the favoured top left quadrant - comparatively lower risk while achieving higher returns.
Summary
The Tower GAM Multi-Trading Fund can offer investors:
- Stand-alone solid performance in its own right;
- Low correlation with performance of equities and bonds, particularly on the downside; and
- Returns that are more stable than those from international equities.
This means that combining the Tower GAM Multi-Trading Fund into a diversified portfolio can give investors the opportunity to better enhance the portfolio's risk-adjusted returns.
| « Demystifying Hedge Funds | How do hedge funds work? » |
Special Offers
Commenting is closed
| Printable version | Email to a friend |


