A Review, and a Look Ahead
Wednesday, January 14th 2015, 9:48AM
by Pathfinder Asset Management
It is customary at year end to put on a seers cap and prognosticate about potential market returns for the year ahead. While we are at least a little bit guilty of that from time to time, before we make any predictions its salutary to take a look forward from a year ago first (just to remind us how accurate predictions usually are).
This is usually a harsh lesson to anyone who claims to be able to forecast financial markets.
Most markets – with the exception of commodities – had an OK to pretty good 2014. Here are some illustrative returns for the year for various asset classes:
In Local Currency terms In NZD terms.
| In local currency | In NZD terms | |
| S&P500 Index | +13.7% | +20.2% |
| NZSE50 Index | +17.5% | |
| US Treasury Index | +6.2% | +12.2% |
| US Aggregate Bond Index | +6.5% | +12.0% |
| Auckland Median House Price | +11.0% | |
| MSCI All Country World | +4.2% | +9.9% |
| NZ Median House Price | +9.0% | |
| NZ Government Bond Index | +8.2% | |
| Gold | -1.8% | +3.8% |
| NZDAUD | +3.5% | |
| ASX50 Index | +7.1% | +3.6% |
| Emerging Markets Equities | -2.2% | +3.4% |
| NZD Trade Weighted Index | +2.2% | |
| Nikkei Equity Index | +8.9% | +0.4% |
| NZDUSD | -5.4% | |
| Bloomberg Commodity Index | -17.0% | -12.3% |
| WTI Oil | -45.9% | -42.8% |
If we pick several of these asset classes, we can rewind back to December 2013 and see what analysts were predicting for 2014 returns.
NZD/USD: FX rates are notoriously hard to pick, but this year analysts did a reasonable job – although there is a very good explanation this. A year ago, NZD/USD was 0.8238, and the implied forward rate was 0.7975. The implied forward rate is the expected rate in a year’s time if nothing changes. It “adjusts” the exchange rate for the difference in yields between the USA and NZD.
Remarkably, there is a very strong anchoring bias that results in most analysts picks being anchored around the forward rate.
For instance 22 of the 45 analysts surveyed a year ago by Bloomberg news had picks within 3 cents of the implied forward rate. So in a year where the currency moved only by a little more than what was implied the median pick was quite good (0.8000) though picks varied from a low of 0.65 to a high of 0.90. Twenty of the 45 analysts surveyed got the direction of the NZDUSD move wrong.
Crude Oil: Admittedly, this was a really tough asset to pick. The selloff in 2014 from US$105 to US$55 was almost unprecedented in an otherwise friendly market environment. The median pick a year ago was US$95.00, with just one analyst with a forecast below $85. With crude oil closing 2014 at $53, the high forecast from a year ago of $114 is looking a long, long way off. The current survey, for oil prices at the end of 2015 has a median price of $75.50 – a full 43% higher than the current spot price of $53. If this eventuates it will be an exciting year for crude oil.
S&P500: Bloomberg surveyed 20 investment analysts a year ago for their S&P500 outlook. The survey resulted in a median estimate of 1950, a low of 1750 and a high of 2100. Compare this to the closing S&P500 print of 2091.
The closest two estimates were 2100 and 2075, next closest 2014. So only one of 20 analysts had an estimate higher than the actual outcome – indicating quite a heavy skew of estimates to the downside. And we should feel sorry for the analyst picking 1750, direction wrong plus a miss of 20%.
Looking at our own predictions for 2014, we are pleased to report that we were more right than wrong.
- Global growth to be stronger than expected, driven by the US (+5% GDP in the last quarter),
- Growth stocks to outperform defensives (just)
- US$ to show strength (US Dollar Index actually up 10% in 2014)
- Europe to exit recession (just)
Less successful was our belief that interest rates would rise sooner rather than later, and for no sign of NZD weakness. (Fortunately we changed our view on a weaker NZD in Q1 2014).
The ending of QE3 in has not led (so far at least) to a rise in long term interest rates. In fact since the end of October 2014 when the Fed halted the $85 billion a month buying of treasury bonds and mortgage securities, 10 year yields in the US have dropped by around 20 bps – in price terms that’s around 1.75%.
What do we expect in 2015?
Broadly speaking more of what we saw in H2 2014. Continuing strength in equities (though expect higher volatility), significant returns from Japan on a currency hedged basis as export company earnings grow significantly. Europe to open a new QE cycle. Commodities have reached their floor at current low levels (well below the marginal cost of production for most assets). Continued growth in global GDP around the world should help commodities in 2015. Chinese growth continues to slow but no hard landing.
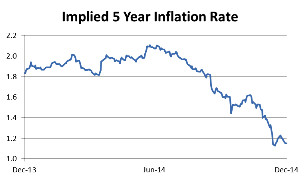
A key influence on at least the start of 2015 can be summed up in the following graph:

This graph shows the market expectation of inflation over the next five years. It is calculated by taking the 5-year Treasury bond yield and subtracting from it the real interest rate as seen on the Treasury Inflation Protected Security (TIPS). The difference is the average implied inflation rate over the next 5 years.
From this graph we can see that the expected inflation rate over the next 5 years has dropped by almost a half since June 2014. Remarkably, the market expects inflation at just 1.1% per annum in the US over the next 5 years.
Is this at odds with the good news coming from the US employment market, and the recent 5% GDP growth in Q3?
The drop in expected inflation since mid-2014 is dramatic and likely to result in nominal rates (i.e., Treasury bonds) remaining low for some time, yet at the same time we are seeing a rebound in GDP, job growth and consumer confidence.
In fact, the days of QE may not behind us as some Central Banks try to stave off deflation. Japan will continue to use every easing tool they can find, Europe is expected to start a QE cycle in Q1, and there is a possibility (we think low) that at some point the US returns to some form of QE. The great interest rate selloff may be some time away.
China looks to have avoided the risk of a hard landing – even with lower growth (circa 7%) China still contributes a large share of global GDP in 2015 – about the same as the US (around 40% of total Global GDP). China is transitioning from an investment led economy to a consumption based economy – the good news is that the Chinese government understands what they are doing and has the tools and monetary firepower to manage the process well.
Low rates for longer than expected have obvious implications for central bank action, equity performance and currency relativity. Low real and nominal interest rates inflate the equity risk premium resulting in equity valuations looking cheap next to fixed interest alternatives.
A year ago, the 10 year US treasury yield was just over 3% and it was very hard to find a commentator calling for lower yields and yet here we are a year later at 2.17%.
Happy investing in 2015!
Paul Brownsey
Pathfinder Assert Management
Pathfinder is an independent boutique fund manager based in Auckland. We value transparency, social responsibility and aligning interests with our investors. We are also advocates of reducing the complexity of investment products for NZ investors. www.pfam.co.nz
| « Tricky time for investors | Watch out for speed bumps » |
Special Offers
Comments from our readers
No comments yet
Sign In to add your comment
| Printable version | Email to a friend |


