Inflation erodes growth and confuses the outlook
Our starting point for this year was that global growth would be ‘satisfactory’ and that it would once again be led primarily by China’s continuing import boom.
Wednesday, April 4th 2018, 9:52AM
by Andrew Hunt
Our starting point for this year was that global growth would be ‘satisfactory’ and that it would once again be led primarily by China’s continuing import boom.
Admittedly, we have found that our specific growth forecasts – that a year ago were towards the high end of the spectrum – have in general been overtaken by the markets over recent months, with the result that our numbers are generally below the consensus but nevertheless we had ‘conceptually’ been looking for economic growth rates to be pleasingly positive and for capacity utilization rates to rise, potentially into ‘overheated territory’ in some cases.
However, we must admit that as we have conducted our various ‘due diligence’ individual country reviews over recent weeks, we have generally found that the data for real economic activity has been softer than even we had been expecting. If we had any notional starting point, it would have been to have expected to find growth but instead we have found the reverse.
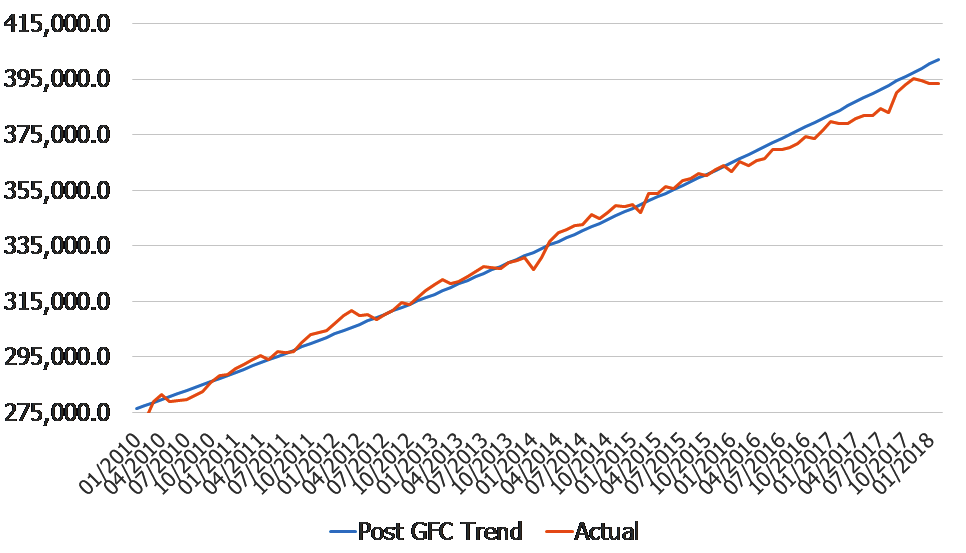
For example, we find that our global PMI data had rolled over (albeit modestly), while we have also become aware that a number of published economic surprise indices seem to have turned down. At a national level, we note that the strength that was visible within the US retail data towards the end of last year seems to have given way and the data is once again tending to under-perform its post GFC trend.
USA: Retail Sales ex Gasoline

In Japan, we have noted that the production data seems to have become somewhat softer and the inventory data has suggested the potential for a further deceleration in output trends.
Moreover, our favoured index of Japanese consumer trends seems to have lost a little of its former momentum. Even in Europe, where we sense that there still is a great deal of residual optimism amongst portfolio managers over the outlook for domestic demand (despite last year’s slowdown in the rate of real domestic growth…), we find that even within the ‘strong German economy, the data for real retail spending and the volume of domestically-sourced orders appear to have turned a little weaker. Interestingly, the foreign orders data remains strong and the trade data itself is continuing to point towards there still being strong shipment trends to Asia at this time. Clearly, the impetus for the slower headline data appears domestic in origin.
In short, as we have trawled through much of the latest ‘higher frequency data, we have found that, although most of the volume of sales or output growth numbers that we monitor remain positive, they have either failed to maintain their previous rates of acceleration or, in most cases, there has been some moderation in growth rates over the last 3 – 4 months. From a practical perspective, we are always a little reticent about drawing ‘big conclusions’ from the January-February data releases; the erratic timing of the Lunar New Year can affect the data and even the US data seems particularly prone to subsequent revision during the early months of the year. Nevertheless, on balance, it does seem that the world economy may have lost some of its previous momentum in volume terms over recent weeks.
However, we must also note that in nominal terms there have been very much fewer signs of a slowdown
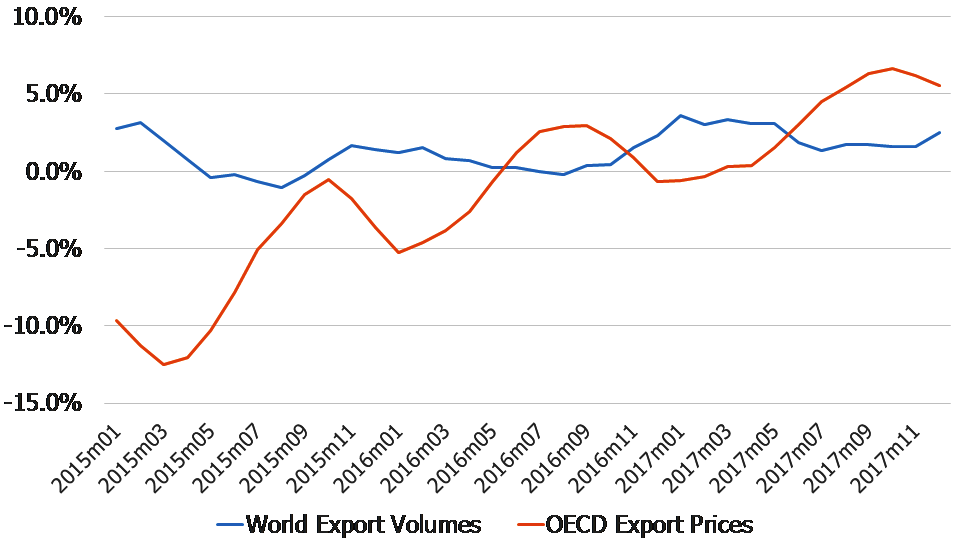
One dataset that has caught our particular attention this week is the CPB World Trade data. This chart seems to rather neatly encapsulate what we have been noting in many over our individual country reviews, namely that volume growth has become a little bit softer (particularly in comparison to 6 – 9 months ago when it was almost ‘booming’) but that price inflation trends have picked up substantially.
CPB World Trade Trends

Of course, even within the context of the OECD export price series that we show above, the behaviour of oil and commodity prices will have been influential in framing the inflation data but nevertheless there can be no getting away from the fact that it is now the price, rather than volume, term that is leading the global nominal trade data higher. This finding of course corresponds to other work that we have been compiling with regard to Asian export price trends. Within this data, we have observed that Asia has become an overwhelmingly inflationary force on the global economy over recent quarters, both through its demand for imports and more pointedly its ‘exporting of inflation’ via its own export prices.
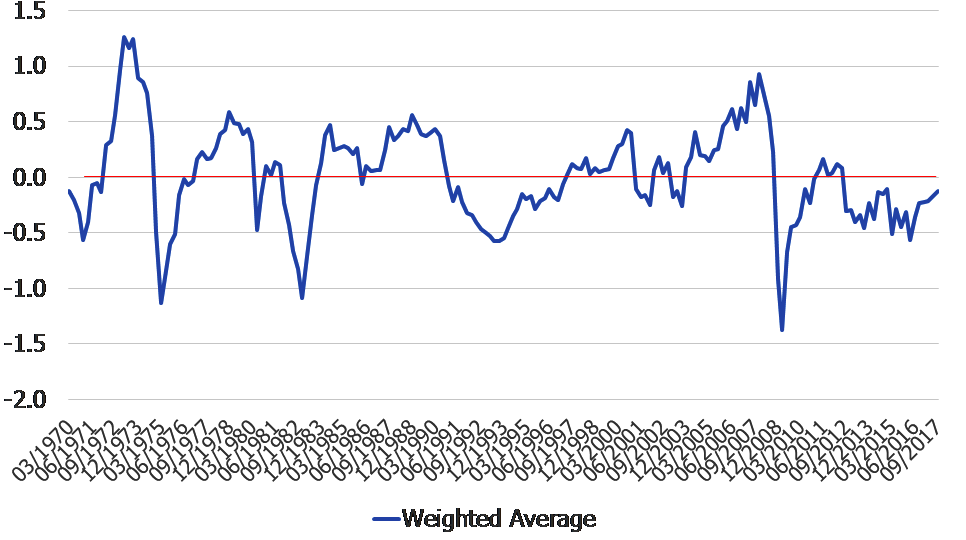
Clearly, world trade price inflation rates have accelerated quite notably but interestingly this has occurred despite the fact that, according to our estimates at least, the global output gap has not yet been closed. Although demand pressure has been rising it remains our assertion that there is still a modest amount of spare capacity within the global economy and in particular within parts of Europe and potentially LATAM. At present, we see no reason to revise this view.
AHEL Global Demand Pressure Index
Given the continued existence of an albeit small negative output gap within the global economy, we can suggest that the recent pick up in global inflation is unlikely to be ‘endogenous’ (this is not to say that it has arrived “from Mars”, merely that it is an external event that seems not to have been related to a conventional “overheating scenario”).
One thing that we know about exogenous inflation shocks, which usually take the form of higher goods and services taxes, higher commodity prices, or higher import prices in general, is that although they will initially lead to an increase in the recorded rate of inflation for obvious arithmetical reasons (i.e. they are part of the CPI basket), these types of shocks will tend to make people ‘poorer’ by reducing the real purchasing power value of their incomes and accumulated assets. Hence, these types of exogenous inflationary shocks are deflationary for growth trends.
Crucially, we find that if we observe nominal and real household income trends in the USA, EZ, UK and, to a lesser extent Japan, we find that rising rates of inflation have begun to erode realised rates of household real income growth, even against the background of generally static (or in some cases even slightly improving) rates of nominal income growth. The global ‘exogenous’ inflation shock appears already to be taking its toll on household income trends and this is likely to be one of the factors behind the recent signs of a cooling in global real growth trends.
In theory, households - or any other economic agents – could circumvent weak real income trends by borrowing in order to augment their spending power but we can also report that global money and credit growth rates have slowed in real terms in many countries. Admittedly, the slowdown in the US data is likely to have been concentrated within the ‘financial sector’ components, and we would argue that the slowdown in the EZ data is in part a measurement issue but, these technicalities aside, it is also a fact that rising inflation has started to take its toll on real money and credit trends within the national economies. Moreover, we also suspect that the growth in cross border credit flows has slowed over recent weeks after what had been a particularly strong run over the course of 2017.
G3: Real Money Growth

As a consequence, we would argue that the shift towards higher inflation, which we have described as being “quasi exogenous” has resulted in a deflation in both income and monetary trends and that it is likely that the recent tendency towards a moderation – or even slowdown – in global growth may well be sustained over the next 3 – 6 months.
We must wonder if financial markets – and particularly bond markets – might soon attempt to welcome these signs of a possible moderation in growth. The conventional wisdom will likely be that, since growth has moderated, capacity utilization rates and labour market pressures will also moderate and so do the central banks’ (tightening) work for them. Indeed, we can imagine that following what could be a brief period of worrying about earnings, even the equity markets might wish to rally on the thought that the Central Banks will not tighten / will continue to buy assets this year….
Unfortunately, the markets’ logic may be sabotaged by the fact that (as we noted above) the inflation seems not to have been related to demand pressure but, instead, to be what we have described as being “quasi exogenous”. Hence, we could find that markets find that the inflation persists even as incomes deflate and growth slows, a scenario that was previously known as stagflation. Rarely has stagflation represented good news for asset markets and we doubt that it will be on this occasion either, particularly given its origin.
Since 2010, the global economy, measured in US dollar terms, has expanded from $64 trillion to $78 trillion. However, the global broad money supply has increased by around a third over the same time period. In fact, we estimate that Global M3 has increased by around $22 trillion since 2010 and the faster rate of growth on money could, at a very top down level, be taken as being suggestive of there being a potentially inflationary monetary overhang within the world. More pointedly, and very much more relevantly, we find that China’s nominal GDP has increased by $5 trillion (thereby directly accounting for a third of the increase in total GDP) but that the dollar value of China’s money supply has increased by $18 trillion, to the point at which China now accounts for around a third of the global money supply despite only being 15% of global GDP. China has provided a massive 82% of all the growth in the global money supply since the GFC (despite the plethora of OECD QEs!).
Consequently, when one talks about a global monetary overhang one is really only saying that it is the PRC that possess a (potentially huge) money overhang. Moreover, it is our firm belief that it has been the increased desire amongst China’s savers to off-load their RMB holdings in the face of increased domestic (financial) repression over recent months that has been behind the recent increase in China’s rate of nominal GDP growth, inflation, demand for imports (both of finished goods and commodities), and of course its direct exportation of inflation via higher export prices. The “quasi exogenous inflation shock” that we noted earlier has its roots firmly in China and the catalyst for its appearance seems to have been the increase in financial repression that began in late 2016.
Between 1994 (i.e. when China devalued by >30%) and 2007, and again between 2012-16, China’s unique economic structure implied that it exported deflation to the remainder of the world via its falling export prices and we firmly believe that it was this feature that gave us the market-friendly mirage of Goldilocks, the distortion of the supply side of many of the Western economies (and the resulting political backlash), and encouraged the West towards a more credit dependent system, with all that this has entailed for the maintenance of financial stability.
However, since the latter part of 2016, China has been exporting inflation rather than deflation but, since China’s export prices and the instability in its demand for money are in a sense exogenous factors for the Rest of the World, the impact of this event is now proving deflationary for global growth.
This situation will leave the West’s central bankers facing an awkward decision, do they react to the higher reported inflation by tightening, or do they react to the signs of slower growth by doing nothing because the “inflation is exogenous”. At present, it is our sense that they are more likely to do the latter, if only because they have been so growth – and asset price – focused for so long now…..
In summary, we suspect that global growth may be weaker, but inflation somewhat higher in 2018 than we were expecting, and the markets are currently still expecting. This situation may leave the bond and equity markets ‘confused’ in the near term, not least because this drift towards stagflation is likely to be used as a reason by the central banks to do ‘as little as possible’ while they wait to see whether the slower rates of growth limit the inflationary pulse. Unfortunately, it is however our fear that slower growth will not in fact contain inflation unless the RMB depreciated in the meantime and that, as a result, the central banks will face still tougher policy choices in 2019 that the markets may also find quite unpalatable.
Andrew Hunt International Economist London
| « Private equity, not govt mandates, KiwiSaver's future: Managers | The Code – issues for advisers (Part One) » |
Special Offers
Comments from our readers
No comments yet
Sign In to add your comment
| Printable version | Email to a friend |


