tmmonline.nz  |   landlords.co.nz        About Good Returns  |  Advertise  |  Contact Us  |  Terms & Conditions  |  RSS Feeds

NZ's Financial Adviser News Centre

GR Logo
Last Article Uploaded: Saturday, December 21st, 2:19PM

News

rss
Latest Headlines

Housing affordability improves

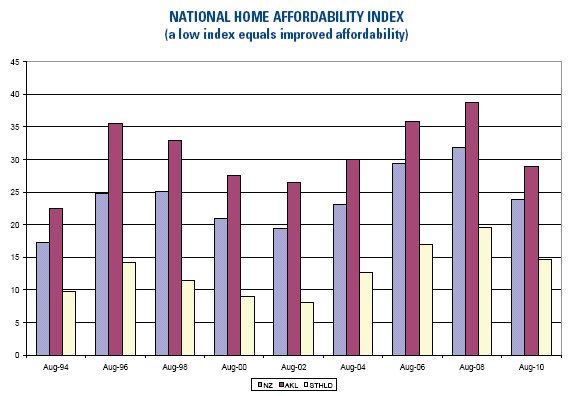
Housing affordability in New Zealand improved slightly in the third quarter of 2010 and improved almost 10% compared to the same time last year.

Tuesday, October 12th 2010, 12:00AM

by The Landlord

Massey University's latest Home Affordability Report shows the national affordability index improved by a small 0.8% in the third quarter and 9.7% on an annual basis, slightly down on the previous year's growth of 11.1%.

Housing affordability is calculated by comparing the affordability drivers, which are household income, median dwelling price and mortgage interest rates.

All three remained relatively subdued in the third quarter of this year, with the average weekly wage increasing $6.15 over the quarter, the median house price remained static at $350,000 and there was a 0.01% decrease in the average monthly mortgage interest rate to 6.59%.

"The housing market is currently characterised by very low turnover rates, expectations that mortgage interest rates will not increase very much in the short term and continuing low wage growth while the economy gradually recovers from the recession and the effects of the Canterbury earthquake," the report says.

On a regional level, seven out of 12 regions showed improvements in affordability for the quarter: Northland 6.4%, Taranaki 3.9%, Otago 2.5%, Hawke's Bay 2.3%, Auckland 1.7% and Nelson/Marlborough 1.3%. The other five regions showed reductions in affordability, with Waikato/Bay Of Plenty declining 3.8%, Canterbury/Westland 2.3%, Wellington 1.6%, Central Otago Lakes 1.3% and Manawatu/Wanganui 0.3%.

On an annual level, all regions showed improvement when compared to the previous year.

Regional annual improvements were led by Taranaki with 20.7%, then Otago 18% and Central Otago Lakes 16.7% in third.

However, Central Otago Lakes remains the least affordable region in the country, with an index of 141.2% of the national average, followed by Auckland's 121.1% and Nelson/Marlborough at 105.4% the average.

Southland retained its place as the most affordable region, with an index of 61.6% of the national average, followed by Otago in second place at 67.9% and Manawatu/Wanganui in third at 71.9%.
« Momentum building in house market, according to ANZFree Investment Property Showcase Events: Auckland, Wellington and Christchurch »

Special Offers

Commenting is closed


print

Printable version  

print

Email to a friend
News Bites
Latest Comments
  • The good guys get told off
    “I can't quite reconcile the rationale, or lack thereof, with the comments so far. Pathfinder were found to have made misleading...”
    2 days ago by John Milner
  • The good guys get told off
    “As a follow on to this conversation: I'm assuming that the Regulator will be consistent by 'naming and shaming' the other...”
    2 days ago by Pragmatic
  • The good guys get told off
    “FMA does not understand the consequences of these type of actions A number of Insurance Companies were taken to court and...”
    2 days ago by LNF
  • The good guys get told off
    “Superlife was censored for using unregistered salespeople however what is not commonly known was that the FMA were aware...”
    2 days ago by Patrickdiack
  • The good guys get told off
    “FMA executive director, Response and Enforcement, Louise Unger said:... Unger was appointed to that role in April of this...”
    3 days ago by Aggressively_passive
Subscribe Now

Mortgage Rates Newsletter

Daily Weekly

Previous News
Most Commented On
Mortgage Rates Table

Full Rates Table | Compare Rates

Lender Flt 1yr 2yr 3yr
AIA - Back My Build 4.94 - - -
AIA - Go Home Loans 7.49 5.79 5.49 5.59
ANZ 7.39 6.39 6.19 6.19
ANZ Blueprint to Build 7.39 - - -
ANZ Good Energy - - - 1.00
ANZ Special - 5.79 5.59 5.59
ASB Bank 7.39 5.79 5.49 5.59
ASB Better Homes Top Up - - - 1.00
Avanti Finance 7.90 - - -
Basecorp Finance 8.35 - - -
BNZ - Classic - 5.99 5.69 5.69
Lender Flt 1yr 2yr 3yr
BNZ - Mortgage One 7.54 - - -
BNZ - Rapid Repay 7.54 - - -
BNZ - Std 7.44 5.79 5.59 5.69
BNZ - TotalMoney 7.54 - - -
CFML 321 Loans ▼5.80 - - -
CFML Home Loans ▼6.25 - - -
CFML Prime Loans ▼7.85 - - -
CFML Standard Loans ▼8.80 - - -
China Construction Bank - 7.09 6.75 6.49
China Construction Bank Special - - - -
Co-operative Bank - First Home Special - 5.69 - -
Lender Flt 1yr 2yr 3yr
Co-operative Bank - Owner Occ 6.95 5.79 5.59 5.69
Co-operative Bank - Standard 6.95 6.29 6.09 6.19
Credit Union Auckland 7.70 - - -
First Credit Union Special - 5.99 5.89 -
First Credit Union Standard 7.69 6.69 6.39 -
Heartland Bank - Online 6.99 5.49 5.39 5.45
Heartland Bank - Reverse Mortgage - - - -
Heretaunga Building Society ▼8.15 ▼6.50 ▼6.30 -
ICBC 7.49 5.79 5.59 5.59
Kainga Ora 7.39 5.79 5.59 5.69
Kainga Ora - First Home Buyer Special - - - -
Lender Flt 1yr 2yr 3yr
Kiwibank 7.25 6.69 6.49 6.49
Kiwibank - Offset 7.25 - - -
Kiwibank Special 7.25 5.79 5.59 5.69
Liberty 8.59 8.69 8.79 8.94
Nelson Building Society 7.94 5.75 5.99 -
Pepper Money Advantage 10.49 - - -
Pepper Money Easy 8.69 - - -
Pepper Money Essential 8.29 - - -
SBS Bank 7.49 6.95 6.29 6.29
SBS Bank Special - 5.89 5.49 5.69
SBS Construction lending for FHB - - - -
Lender Flt 1yr 2yr 3yr
SBS FirstHome Combo 4.94 4.89 - -
SBS FirstHome Combo - - - -
SBS Unwind reverse equity ▼9.39 - - -
TSB Bank 8.19 6.49 6.39 6.39
TSB Special 7.39 5.69 5.59 5.59
Unity 7.64 5.79 5.55 -
Unity First Home Buyer special - 5.49 - -
Wairarapa Building Society 7.70 5.95 5.75 -
Westpac 7.39 6.39 6.09 6.19
Westpac Choices Everyday 7.49 - - -
Westpac Offset 7.39 - - -
Lender Flt 1yr 2yr 3yr
Westpac Special - 5.79 5.49 5.59
Median 7.49 5.79 5.69 5.69

Last updated: 18 December 2024 9:46am

About Us  |  Advertise  |  Contact Us  |  Terms & Conditions  |  Privacy Policy  |  RSS Feeds  |  Letters  |  Archive  |  Toolbox  |  Disclaimer
 
Site by Web Developer and eyelovedesign.com