Investors deserve clearer insights
The risk with risk indicators
Wednesday, May 8th 2019, 10:42AM  1 Comment
by Michael Lang

It is disappointing that a decade after the global financial crisis, New Zealanders continue to remain vulnerable because of the rules around risk indicators.
This is especially the case for bond investors, who are often conservative in nature and consider fixed interest a safe haven in times of volatility.
Unfortunately, after a decade of low interest rates, bond investors are also prone to “reaching” for higher yields, sometimes without understanding the risk they are taking. This is when risk indicators play a vital role – by helping New Zealanders understand how risky their “income” product is.
Given this backdrop, should a portfolio whose largest investment, comprising approximately a fifth of the fund, is an off-market, related party, private loan to a portfolio of shares, be given the same risk indicator as a term deposit from a major Australasian bank?
Sadly, this is what is happening. A portfolio (which we’ve chosen not to name) contains in its top ten holdings, an off-market, related party “geared investment loan” which makes up 19.09% of the portfolio. Of the top ten investments, seven are unrated. Yet its risk indicator is one, the lowest possible.
The fund is described as “entirely in income assets” and promoted as being “suited to investors looking for an on-call or term investment with a low level of risk and are willing to accept a relatively modest level of returns”. This is language which is commonly associated with bank accounts and term deposits. How is this possible?
HOW IS RISK MEASURED?
The Financial Markets Authority have done an excellent job establishing a standarised formula for risk which enables an “apples with apples” comparison. Risk is measured through a score of one (lowest risk) through to seven (highest risk).
Risk is assessed by taking the actual annualised volatility of the fund or asset class over the last five years.
WHEN IS VOLATILITY USEFUL?
Where an asset trades regularly, between a large number of willing buyers and sellers, with little transaction cost, then daily movements in price either up or down (called volatility) are an excellent measure of the risk. This is the case for listed (not privately held) shares, property funds, unit trusts and most commodities.
WHEN IS IT MISLEADING?
Unfortunately, volatility is a poor indicator of the risk of loss for assets that are priced infrequently and this includes bonds. For a start, most bonds including New Zealand Government bonds, are not listed, they trade off-market by appointment. Next, unlike perpetual assets, bonds are binary in nature: interest is either paid, or not, and at the end of the period your money is either repaid, or not.
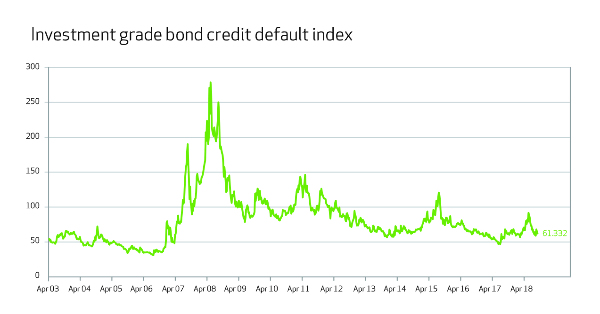
In a 150-year study of corporate bond default risk, the authors found bond defaults were not normally distributed. Instead, there were long-periods of little volatility or default, which were then followed by a short bursts of high volatility and a large number of defaults.
The investment grade bond credit default index is an excellent measure of the episodic nature of bond volatility and is shown below.
In the case of the income securities portfolio with its related party “geared investment loan”, the manager sets a “posted rate” in the same way as finance companies do. As a result, the volatility is low. Using the FMA’s current methodology for risk indicators, lower volatility equals a lower risk indicator.
WHAT IS THE ALTERNATIVE?
The alternative is to have risk indicators which reflect the type of assets a fund holds.
For example, a portfolio which is entirely invested in listed shares should attract the highest risk indicator, whereas one that is equally divided between shares and bonds should have a medium to high risk indicator, say three to five.
Funds holding cash, government bonds with a duration of less than three years, bank bills and investment grade bonds should have a lower risk indicator. In contrast, funds holding unrated bonds and related party loans should be required to have a higher risk indicator.
Interestingly, the website Sorted, run by the Commission for Financial Capability, categorises funds by asset allocation and not with the FMA’s prescribed risk indicator.
1. For further details contact NZ Funds.
2. Giesecke, K., Longstaff, F., Schaefer. S., and Strebulaev, I., 2011. Corporate bond default risk: A 150-year perspective. Journal of Financial Economics 102 (2011), 233 – 250.
NZ Funds KiwiSaver Scheme is designed for use by AFAs and RFAs and pays both planning incentives and an ongoing commission for advice. 96% of NZ Funds’ KiwiSaver members have a financial adviser. The average balance of members of the Scheme is $27,194 approximately one and half times the national average of $17,834.
Michael Lang is Chief Executive at NZ Funds. New Zealand Funds Management is the issuer of the NZ Funds KiwiSaver Scheme.
| « BNZ cuts KiwiSaver fees | NZers admit they should be saving more » |
Special Offers
Comments from our readers
Sign In to add your comment
| Printable version | Email to a friend |


The FMA have made a truly horrible decision in using these measures as they simply are not appropriate for many investors.
There is no easy way to describe risk to investors unfortunately.