Mirror, mirror on the wall, who has the best lifecycle of them all?
A recent NZ Funds-commissioned survey by MyFiduciary gives interesting insights into the KiwiSaver life-stages options available.
Tuesday, November 5th 2019, 9:02AM
by Michael Lang

Michael Lang
Most advisers know that around 90% of the variation in a KiwiSaver member’s returns is due to asset allocation and that younger investors should have a greater exposure to growth assets than older investors.
They also know that KiwiSaver is a scale game, as member balances are too low to adequately compensate financial advisers for providing much more than a cursory financial overview.
It is therefore logical that the legislation is supportive of lower-cost robo alternatives and that the Ministry of Business, Innovation and Employment (MBIE) and the Treasury have announced they will be considering making the default option a lifestages approach.
NZ Funds recently commissioned independent experts MyFiduciary to review the life-stages options available in New Zealand. Here are some selected insights from their report.
LIFE-STAGES MANAGERS
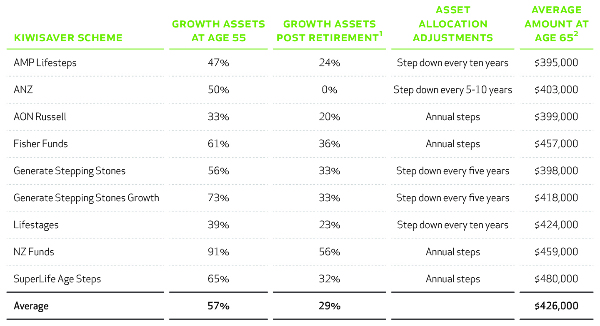
Nine out of 22 managers offer a life-stages option. Of these, four managers – AMP, ANZ, Generate and Lifestages – change allocations infrequently and by a large amount. The other managers – NZ Funds, AON Russell, Fisher Funds and SuperLife – have smoother adjustment paths.
Leaving a member’s allocation to growth assets unchanged for five to ten years, then dropping their weight substantially overnight, can be a major problem if the rebalancing date coincides with a bad period for equity markets. A smoother glidepath with, for example, annual rebalancing reduces the chance of de-risking at a bad time.
ALLOCATIONS TO GROWTH
A common theme from academic research into optimal life-stages strategies, and from reviews of actual products in the market, is that current life-stages options are too conservative, with investors being better off if their portfolios did not become less aggressive until much later in their lives.
The glidepaths of managers in New Zealand tend to be very conservative. At age 65 the average allocation (excluding NZ Funds) is 26% growth / 74% fixed income. In contrast, NZ Funds starts the de-risking process at age 55 from a higher growth allocation. Clients have more than half their portfolio in growth assets until they are in their mid-80s.

Source: MyFiduciary. 1. Post retirement is the average from age 65 to 80. 2. Terminal wealth is measured in today’s dollars, ie adjusted for inflation. Based on a Monte Carlo simulation for a person who starts saving at age 25 with a starting salary of $75,000. Based on 4% contribution rate plus 3% employer contributions. The terminal wealth evaluation includes each scheme's estimated fund charges including performance fee and administration charges. For more information contact NZ Funds.
EXPECTED OUTCOMES
MyFiduciary modelled a person who starts saving at age 25, has an income of $75,000 that grows through time, and saves 4% of their income (plus a 3% employer contribution) in a life-stages strategy across different managers.
The average of all balances at 65 years of age was $426,000. Savers who choose NZ Funds, Fisher Funds or SuperLife achieved a higher level of expected wealth at retirement after fees. For example, a saver who invests in the NZ Funds’ LifeCycle strategy would expect to have $459,000 at age 65 (adjusted for inflation, ie measured in today’s dollars). In contrast, savers who selected AMP Lifesteps, AON Russell or Generate Stepping Stones had less expected wealth at retirement of between $395,000 and $399,000 – approximately $64,000 or 14% less.
The MBIE and Treasury Discussion Paper notes that if the Government chooses a life-stages option as the default option, the Government would set the investment mandate of each stage and the ages at which each stage would apply. They also note that a conservative final stage would be too conservative for those approaching retirement, given average life expectancy is much higher than the retirement age.
Advisers need not wait for the Government to make a decision. Life-stages options which have high expected retirement value are already available in the market.
Michael Lang is Chief Executive at NZ Funds. New Zealand Funds Management is the issuer of the NZ Funds KiwiSaver Scheme.
| « Investors prepared to switch for ethical funds, report shows | Life stages research shows big differences in outcomes » |
Special Offers
Comments from our readers
No comments yet
Sign In to add your comment
| Printable version | Email to a friend |


