Does reporting season really matter.
In this article we consider the importance of reporting season.
Friday, October 1st 2021, 8:44AM
by Stephen Bennie

Last month was one of the year’s two big reporting seasons. The majority of listed companies have either a December or June year end, which means that in February and August most companies release either their full year or half year results. This leads to a flood of information for investors and market participants to dive into, should they so choose to. Broking and buy-side analysts alike are typically not allowed to take leave during reporting season such is the workload and the perceived importance of reporting season. They have to keep clients and colleagues updated on any changes that they make to their earnings forecasts as a consequence of the result and any associated earnings guidance that the company has made.
Company results that lead to widespread earnings upgrades are coveted, and often rewarded with a rising share price. Company results that lead to earnings downgrades are often a blight on an investment portfolio as they typically have a falling share price. Hence, the importance that many share market participants place on reporting season. However, long-term investors that typically hold shares in a company for five or more years place far less importance on the potential ramifications of any given earnings season. A good way to explain that approach is to take the example of Capral.
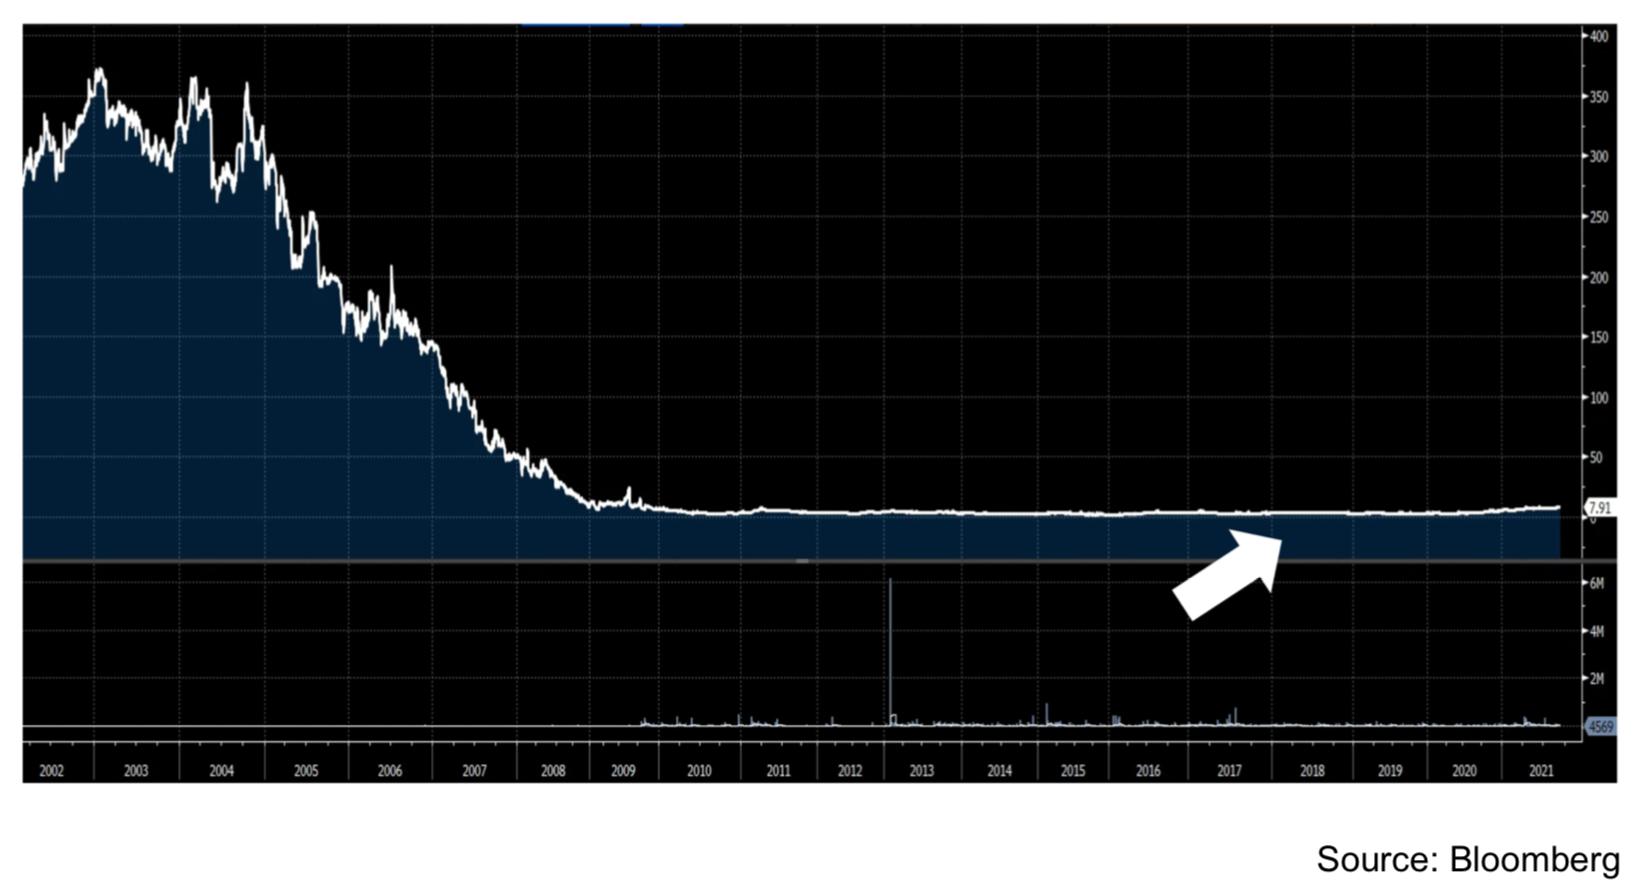
As the chart below shows, Capral’s share price has fallen a great deal from where it traded 20 years ago. At its worst the drawdown represented a 99.5% drop in share price. Some readers might be familiar with Capral as it was listed on the NZX and was a holding in the Guinness Peat Group investment portfolio. It is a simple business, it is Australasia’s largest producer and distributor of aluminium products, and it should make a reasonable profit, nothing dramatic but a reasonable return on equity should be earned. Clearly though, as the share chart demonstrates, decades of underperformance led to a distinct lack of earnings. It was a perfect storm of too much debt, too much production capacity, falling customer demand, increasing offshore competition, onerous leases, excessive senior management renumeration, multiple capital raises, endless losses and abandoned dividends. Hence the 99.5% drop in share price.
Chart showing 20 years of value destruction delivered by Capral
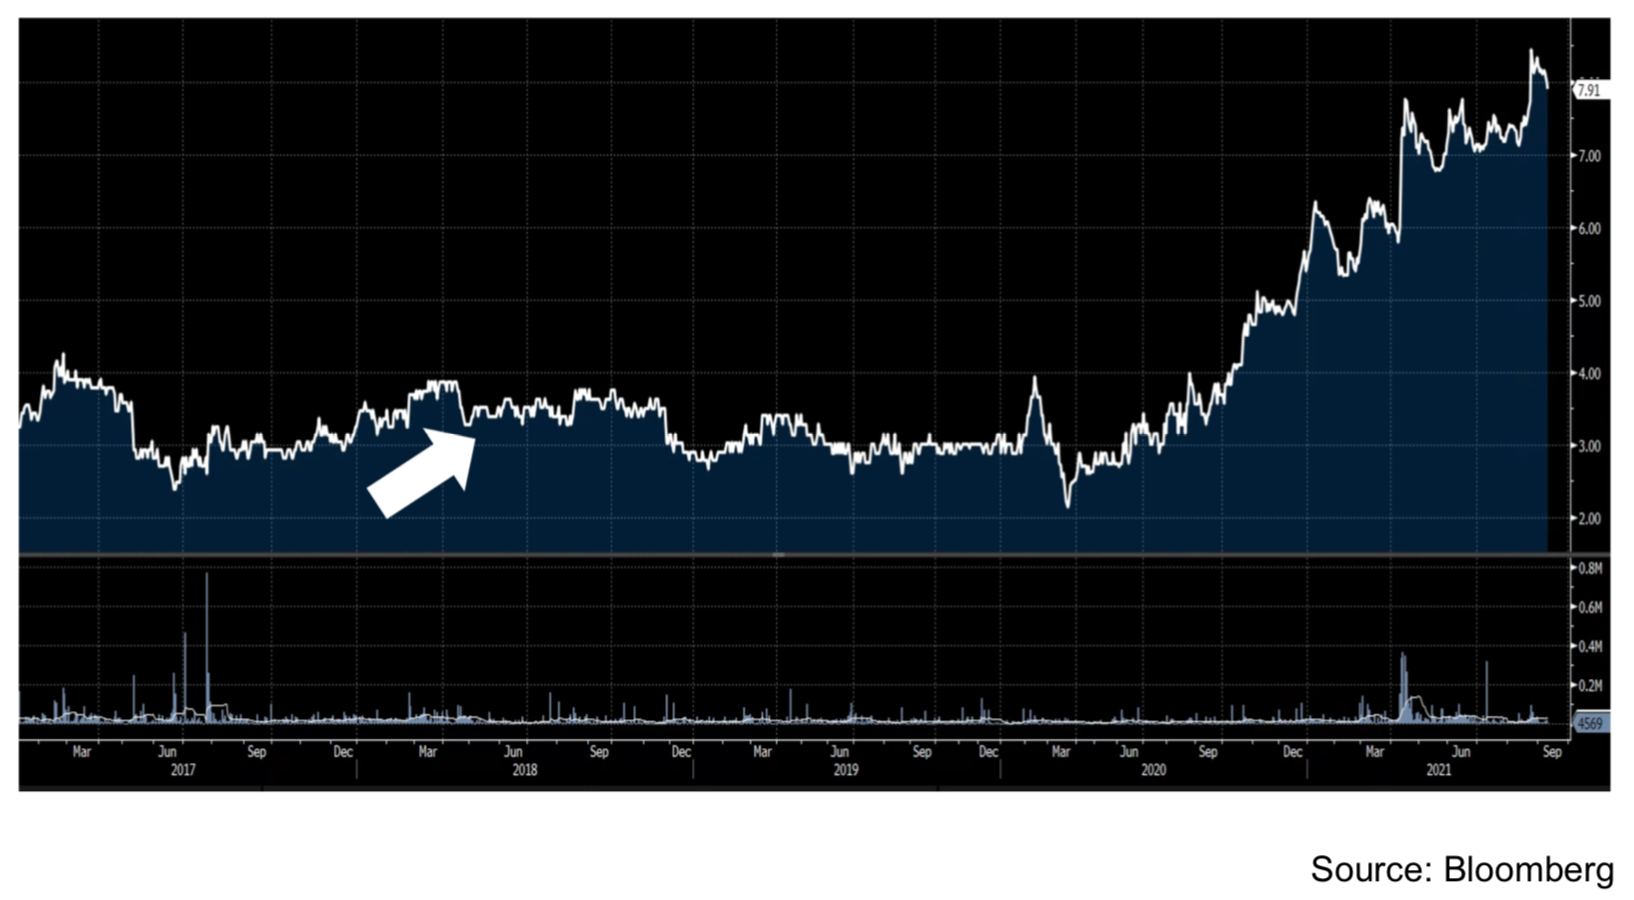
 The arrow in the chart indicates that in May 2018 we added a position in Capral to our funds. The scale of the long-term chart is so severe that it is impossible to see that three and half years on, the investment in Capral has yielded a good return. The shorter-term chart below gives a better impression of that positive return from holding Capral from May 2018.
Chart showing a recent 100% plus return by Capral
 An interesting aspect of the chart above, and it’s a consistent theme for long-term investors, is that we held Capral for nearly 3 years before it started to perform well. And yes, in a perfect world we would have purchased Capral in September last year and have doubled our investment in less than 12 months. But we don’t live in a perfect world, and as investors in Capral we were faced with two great unknowns. Firstly, when would earnings finally turn around and secondly when would the share market care and acknowledge that turn around. Our view was that over the past two decades the business had made the necessary changes to its operations, management, and balance sheet such that the business could once again make a decent return on its capital. However, knowing exactly when that will happen is very difficult, but we believed that by looking out three to five years we could have a high degree of confidence that decent earnings would once again be delivered.
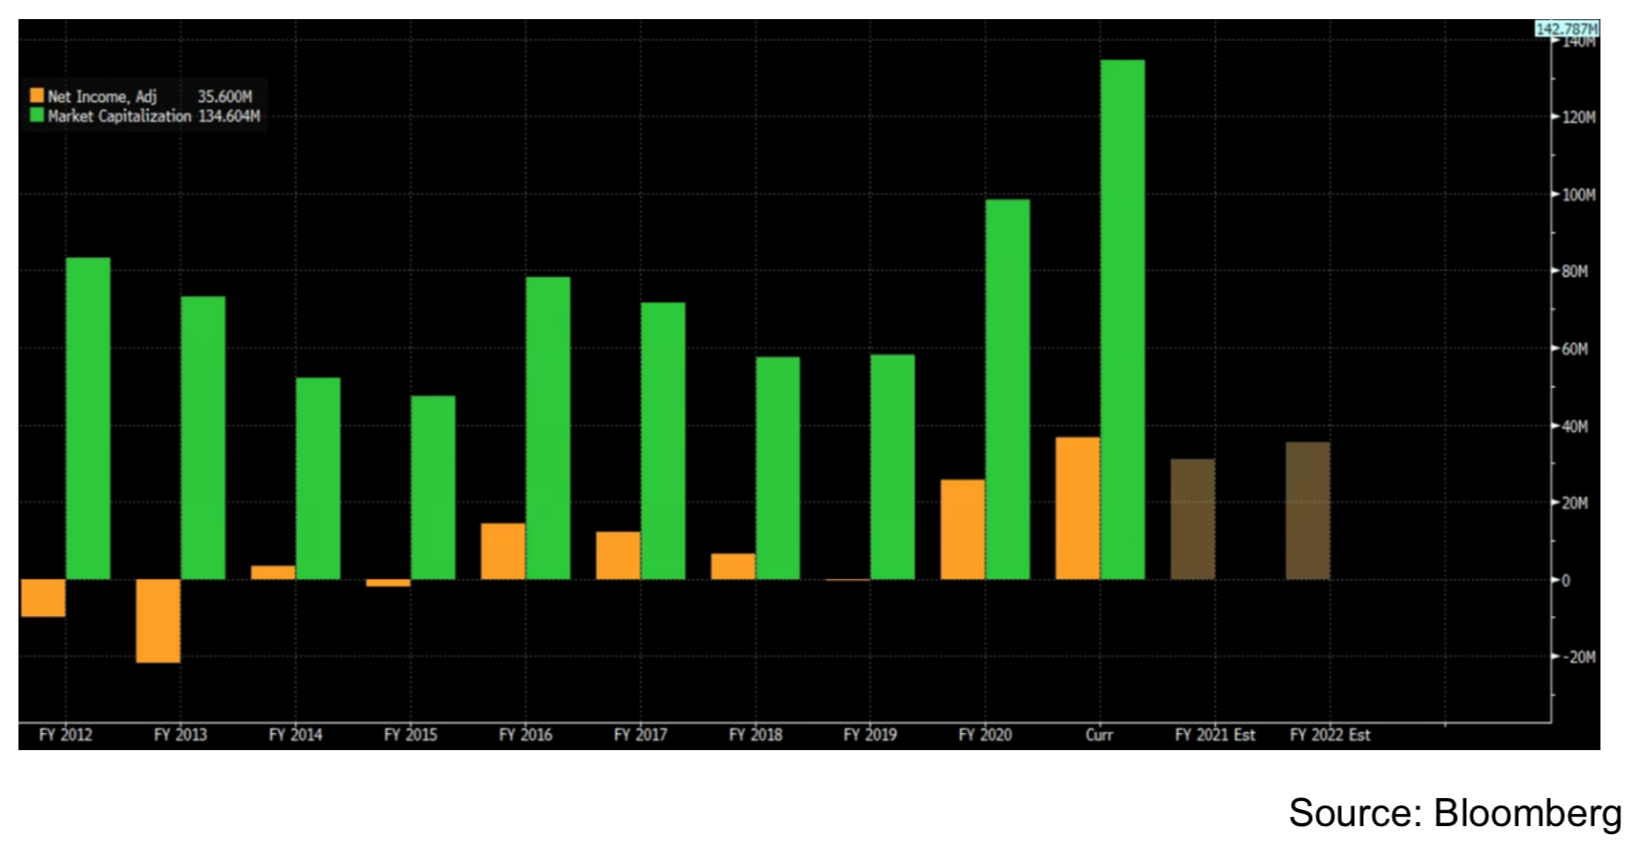
Table showing the past decade of Capral’s market cap and net income In the table above the green bars represent the market capitalisation of Capral, i.e. the number of shares on issue times share price. Share price goes up, the market capitalisation goes up. The yellow bars show Capral’s reported net income, or as so often has been the case for Capral, its net loss. The positive bar in 2016 was only its second profit since 2002!
Clearly reporting season for Capral shareholders can be a tough time. And there can be little doubt that if you were in the majority and an investor for whom a positive reporting season is important, you were unlikely to even consider buying Capral in May 2018. And just as predictably Capral proceeded to report another loss in 2019, with a corresponding sideways slide in share price. But as a long-term investor we were unfazed and remained positive about the medium-term prospects for the business.
Another way of looking at the long-term approach, is that at some point earnings have to improve and that ultimately reporting season does matter. You can see from the table above that as Capral started to report improving earnings in 2020 and then in 2021, the green market capitalisation bars also started to grow. However just as important to making this a successful investment was not placing too much emphasis on the difficult reporting seasons of 2018 and 2019, as by the time earnings started to improve, the best buying opportunities were gone.
Disclaimer
The following commentaries represent only the opinions of the authors. Any views expressed are provided for information purposes only and should not be construed in any way as an offer, an endorsement or inducement to invest. All material presented is believed to be reliable but we cannot attest to its accuracy. Opinions expressed in these reports may change without prior notice. Castle Point may or may not have investments in any of the securities mentioned.
About Castle Point Funds Management Limited
Castle Point is a New Zealand boutique fund manager, established in 2013 by Richard Stubbs, Stephen Bennie, Jamie Young and Gordon Sims. Castle Point’s investment philosophy is focused on long-term opportunities and investor alignment. Castle Point is Morningstar Fund Manager of the Year 2021 – Domestic Equities.
About Stephen Bennie
Stephen is a co-founder of Castle Point. He has over 25 years of investments experience
and 18 years of portfolio management experience in New Zealand and abroad. Stephen holds a Bachelor of Commerce (Hons) in Business Studies and Accounting from the University of Edinburgh in 1991 and is a CFA charterholder.
More information can be found at:
www.castlepointfunds.com.
| « How many Kiwis has KiwiSaver Saved? | Higher fee KiwiSaver managers delivering superior returns » |
Special Offers
Comments from our readers
No comments yet
Sign In to add your comment
| Printable version | Email to a friend |


