Gender pay gap and not contribution rates disadvantage women on KiwiSaver
Research by Auckland University of Technology for the Retirement Commission points to the gender pay gap as the main cause for women contributing less.
Wednesday, April 3rd 2024, 5:11AM
by Andrea Malcolm

AUT used Stats NZ’s new integrated data infrastructure (IDI), which covers KiwiSaver contribution rates from April 2019, for its analysis. The Retirement Commission says the new research complements a 2022 study it commissioned from Melville Jessup Weaver.
While the latter looked at KiwiSaver balances across a range of demographics, the new research examines contribution rates across different demographic groups.
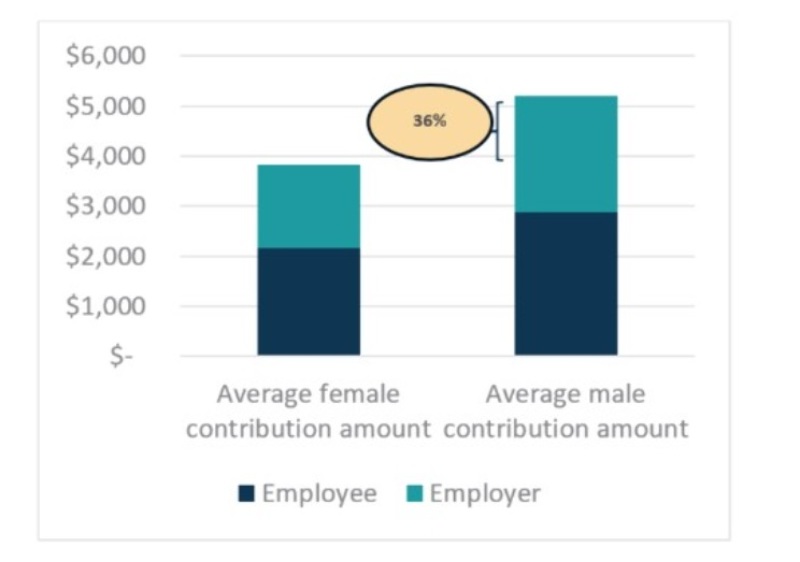
Despite women contributing to KiwiSaver at about the same rate as men, women are putting away 36% less per year.

The data shows a very high percentage of paid employees (arguably the main target of the scheme under its current settings) are contributing, with only a small number on savings suspensions at any one time, and most savings suspensions lasting less than a year.
Men spend more time on savings suspensions than women (5.6 months compared to 5.2 months). For women non-contributing months are more likely due to periods out of paid work compared to men.
Message to employers
Retirement commissioner Jane Wrightson wants employers to look at their KiwiSaver policies and ask “whether they have their employees’ best interests at heart.”
The research also found that one in three employees contribute at a rate higher than the 3% minimum but less than 10% of employers do the same.
And instead of paying KiwiSaver contributions on top of an employee's earnings, almost half of employers include them in total earnings for at least some of their employees, 25% use the same approach for all employees, and 20% for some of their employees.
The use of a total remuneration approach by employers in the study didn’t appear to be influenced by organisational type such as the size, age of firm, or whether it is private or private, a policy brief by the commission says.
It goes on to say this is not how KiwiSaver is designed to operate but is not legislatively prohibited so long as the outcome is the result of good faith bargaining.
The removal of the incentive of having the employer contribution on top of salary or wages could also be one explanation for periods of non-contribution (savings suspensions) by people in paid work but further research asking people why they took a savings suspension would be needed to find out whether this is the cause.
“If we want to see change, I think we need to see a more proactive attitude across the board from employers. We all have a stake in New Zealand’s future and there are concerns that people may not be saving enough for retirement, so we need to be taking practical steps to tackle these issues.”
Retirement Commission policy lead, Dr Michelle Reyers, says new data presents an opportunity to look deeper into the forces causing contribution amounts to differ so significantly across gender and ethnicity.
“The data allows us to examine the individual characteristics of KiwiSaver members in a way we’ve never been able to before. It exposes some clear imbalances which tell us that if we don’t make changes, we are on a pathway to continue seeing the inequalities we are already seeing in our retired population for decades to come,” she says.
According to Stats NZ, the gender pay gap was 9% in 2021, and larger for Māori and Pacific women.
Women are also more likely to work part time and take on unpaid caring responsibilities, further exacerbating this gap, which is why we are seeing the larger difference in the dollar value of contributions into women’s accounts compared to men’s accounts in this research.
The research shows ethnic pay gaps are also mirrored in lower KiwiSaver contribution amounts for Māori and Pacific Peoples. If you are Māori or Pacific, you are likely to have around $1,500 less contributed into your KiwiSaver account annually than a European person.
However, Māori have the second highest average employee contribution rate of the ethnic groups reported in this research, despite having the lowest average income.
The data highlights the sizable impact of ethnic and gender pay gaps on New Zealanders’ abilities to prepare adequately for retirement. It is already known that Māori, Pacific Peoples and women are more likely to be reliant on NZ Super in retirement due to lower savings and investments.
| « Bayly will talk to coalition partners before any change to KiwiSaver | Best and worst KiwiSavers according to Consumer » |
Special Offers
Comments from our readers
No comments yet
Sign In to add your comment
| Printable version | Email to a friend |


