Tale of two halves
Over half of the North Island’s regions registered falls in their average asking price in May – in contrast to the South Island, the latest Realestate.co.nz data reveals.
Tuesday, June 4th 2019, 10:21AM
by The Landlord

Northland, Auckland, Central North Island, Coromandel, Hawkes Bay, Manawatu/Wanganui, Wairarapa all saw their asking prices decline in May as compared to April.
The biggest falls were in Coromandel (down 5.1% to $745,852) and the Central North Island (down 4.8% to $470,837).
Auckland’s average asking price dropped by 2.7% to $875,476.
However, the Waikato and Wellington regions hit all-time highs, up 3.2% to $626,776 and up 4.2% to $684,300 respectively.
The Bay of Plenty and Gisborne markets remained static, while Taranaki saw an increase of 2.2%.
Realestate.co.nz spokesperson Vanessa Taylor says the North Island appears to, largely, be in a holding position and this is in stark contrast to the relatively buoyant South Island.
Five of the seven South Island regions registered lifts in their average asking prices, with two regions hitting new record asking price highs.
They were Otago where the average asking price rose by 8.3% to $454,102 and Southland which saw its average asking price climb by 9.5% to $344,688.
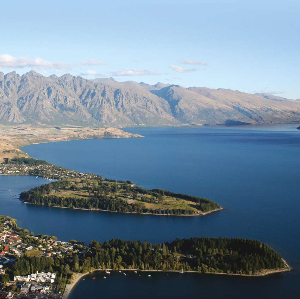
Taylor says that the Central Otago/Lakes region is also flying high with the region’s average asking price tipping back over the one-million-dollar price tag to $1,009,578.
“New listings are up (by 20.6% year-on-year), the average asking price is up and the total number of houses available for sale is up (by 25.1%).
“It’s arguably the liveliest region across the country and it’s not only New Zealanders taking a look.”
Nearly a quarter (24.1%) of all views to Central Otago/Lakes property on realestate.co.nz in May originated from Australia – which is exempt from the foreign buyers ban, she says.
“For those looking to sell in the region, it makes sense to list properties ahead of the peak winter season so that property hunters have time to consider options.”
Meanwhile, the national average asking price lifted by 1.1% to $656,685 in May, as compared to April.
Of the bigger markets, it was the Wellington region which performed the best, with its average asking price rising by 4.2% to an all-time high of $684,300.
Taylor says it’s an interesting picture and somewhat defies supply and demand logic as, typically, if there’s a scarcity of listings, asking prices tend to lift.
But the total number of homes for sale in Wellington was up by 18.4% in May, as compared to the same time last year.
“The Wellington region has had a shortage of listings in recent times and we will be watching with interest to see how this situation unfolds during 2019,” she says.
As to Auckland, its average asking price is down while its total stock is up by 10.8% year-on-year.
Taylor says that means people should be looking to whether they need to be more negotiable on price, particularly as they will be selling and buying in the same market.
| « Housing crisis needs building surge | Market rebound coming - Westpac » |
Special Offers
Comments from our readers
No comments yet
Sign In to add your comment
| Printable version | Email to a friend |


