Beware a 2019 recession
Talks of an impending global recession are making the headlines once again but what exactly are the driving factors?
Monday, April 10th 2017, 10:19AM
by Harbour Asset Management
Some superstitious investors worry about the chance of a global recession in 2017. They figure that the stockmarket crash in 1987, Asian crisis in 1997 and start of the GFC in 2007 make this the obvious year for troubles in markets. While it is difficult to find an economist that will forecast a recession, the maturity of the business cycle does warrant some caution. However, first we need to see more signs of consumer price inflation. So 2019 may be the year to watch.
Recessions can be caused by a number of different shocks to knock an economy off course. But typically recessions occur as the culmination of a business cycle.
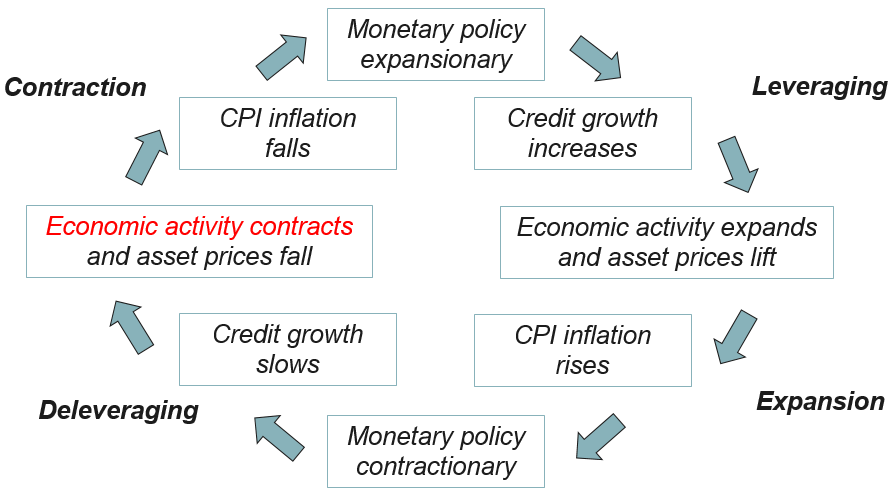
Economic expansions normally start with low inflation and low interest rates. Provided access to credit is plentiful, economic activity expands and asset prices become elevated. Eventually the economy runs out of spare capacity and CPI inflation pressures start building. Then, ultimately, central banks become concerned that CPI inflation will get out of control, prompting them to apply the brakes and tighten monetary policy forcefully (Figure 1). The bigger the boom time; the sharper the correction.
Figure 1. Typical economic business cycle

Source: Harbour Asset Management.
The problem with trying to forecast a recession is that most hard economic data is released with a lag. To make matters worse, many so-called “leading indicators” are actually “coincident indicators”. For example, business and consumer confidence numbers tell us much more about economic activity right now than in the future. They are soft economic information, helping us to understand how the economy is currently tracking, until the hard official economic data on economic activity is published months in the future.
However, it turns out that there is at least one genuine leading indicator of a recession. That is the shape of the yield curve; the difference between short-term and long-term interest rates.
The appealing feature of this indicator is that it also fits intuitively with our understanding of the business cycle. In normal times, long-term interest rates typically sit at a margin above short-term interest rates. However, when central banks become concerned about inflation, they lift short-term interest rates sharply. As a result, this gap between short-term and long-term interest rates narrows, and at an extreme inverts. Over the past 50 years in the US, these episodes have tended to precede an official recession.
Figure 2. The Yield Curve as a Leading Indicator
Source: Bloomberg and NBER.
The current economic expansion in the US has lasted 94 months, and if it continues an extra two years it will be the longest stretch since data first became available in 1850.
The unusual thing about this post-GFC expansion has been the almost complete absence of inflation pressures; central banks have been more occupied by fears of deflation. This has kept monetary policy loose for a considerable period, with the US Federal Reserve, European Central Bank and Bank of Japan all pre-occupied with trying new ways to avoid the threat of deflation.
However, the inflation outlook may be changing. The US Federal Reserve has already recognised this by starting a cautious process of lifting the US Fed Fund Rate, beginning from December 2015. BCA Research has identified the prospect of economic stimulus from the Trump administration as creating the classic conditions for a late cycle boost to inflation, leading to tighter monetary policy, and an eventual recession.
In our view, the underlying economic data in the US and Europe has been strong, even before the prospects of an additional expansionary US fiscal package are considered. However, inherent economic lags mean that it should still take some time for strong economic activity to translate into CPI inflation pressures that become a genuine concern. CPI inflation continues to be the missing part of the puzzle, and is at the top of our watchlist of risks.
The worst scenario for markets is that these themes emerge in the US, Europe and China at the same time. In that case, a global tail-wind of easy monetary policy would turn into a head-wind.
For those not superstitious, leading indicator models point to a very low probability of a recession in 2017. For those attuned to the business cycle, watch more closely for 2019.
Christian Hawkesby, Executive Director
Head of Fixed Interest and Economics
Harbour Asset Management
This column does not constitute advice to any person.
www.harbourasset.co.nz/disclaimer/
Important disclaimer information
| « Ready for Bretirement? | Socially responsible investing (Part 3): returns, fees and investment options » |
Special Offers
Comments from our readers
No comments yet
Sign In to add your comment
| Printable version | Email to a friend |


